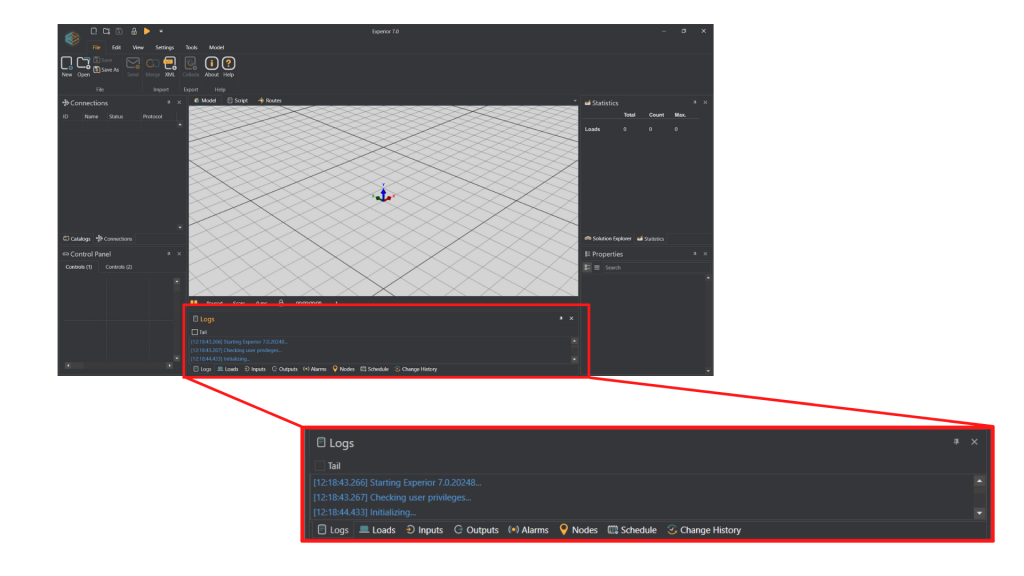
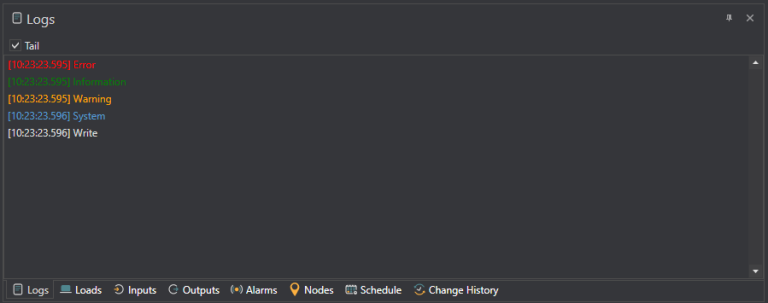
The logs are where you can see feedback from Experior. It will give you different information on how the program is running as well as error messages and warnings if something is not working correctly. All the feedback comes with a timestamp, so you can see when it happened. This makes the logs a great tool for debugging. The feedback comes in four different colors as well as a color that matches the theme (which in this example is white):
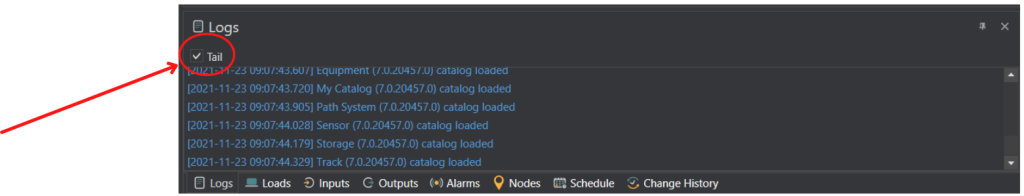
Above the feedback window is a checkbox marked ‘tail’:
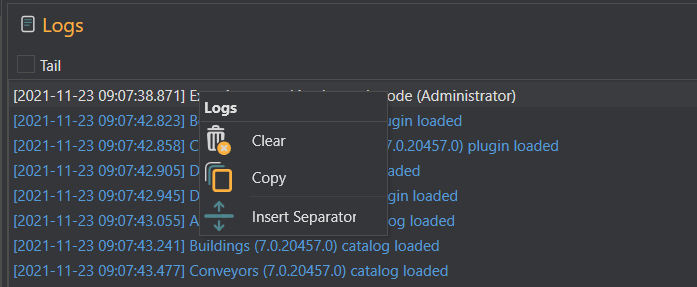
By checking this checkbox you make sure that the logs window is always showing the bottom of the feedback reel. If you right click on any of the messages in the feedback reel you will see a menu which looks like this:
CLEAR: Delete all messages in the log. COPY: Copy the highlighted text INSERT SEPARATOR: Insert a separator line at the bottom of the feedback reel.
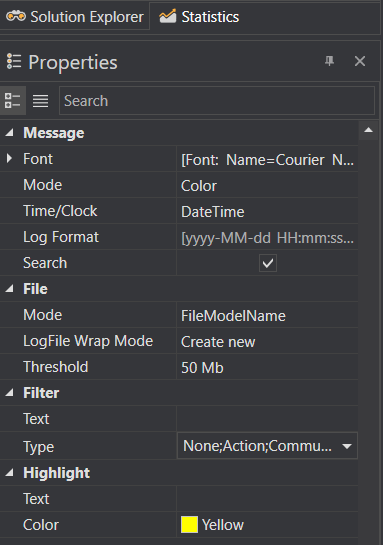
If you click on one of the log messages you will see further information about it and be able to customize the log in the Properties window:
MESSAGE: FONT: Set the font in which the log messages are displayed MODE: Choose between displaying the messages in color or monochrome TIME/CLOCK: Choose the log format for the messages. The chosen format is displayed below in the ‘log format’ line SEARCH: Will highlight any assemblies whose name matches any word in the chosen log message FILE: MODE: Choose the way the files name is displayed LOGFILE WRAP MODE: Lets you choose if and when a new log file is created FILTER: TEXT: Write any text you want the log to filter by from then on. Only messages containing this text will be shown in the log TYPE: Choose which types of messages you want to be shown in the log HIGHLIGHT: TEXT: Write any word you want highlighted in the log COLOR: Choose the color which is used to highlight
2. Loads
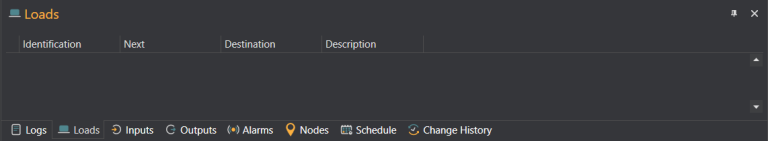
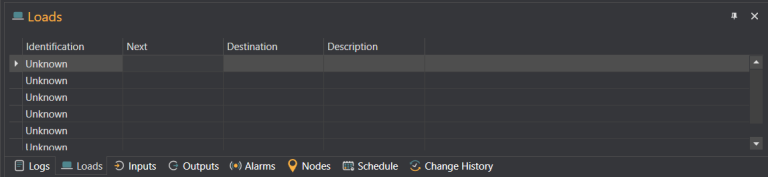
This window shows the loads in the scene. When you open a new model, the loads window will be empty like above. If you then add one or more loads to the scene, right click in the loads window and then press refresh the loads will show up in the window like so:
The ‘Identification’ column shows the identifier (usually a barcode) of each load (here called Unknown). If you wish to change the identifier of the load you can do so in the identification box in the properties window. The ‘Next’ column shows the next action point the load will hit. ‘Destination’ shows the loads final destination and ‘Description’
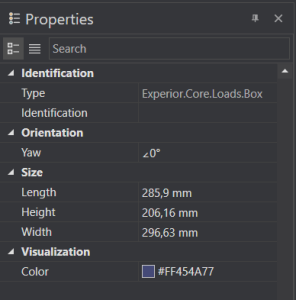
If you select one of the loads, the model window will show you this specific load. The Properties window will then display the information of that specific load:
Here you can get information about the loads weight, position etc. The ‘Identification’ line will let you give the load a name to distinguish loads from each other. The color line will let you change the color of the load.
3. Inputs & Outputs
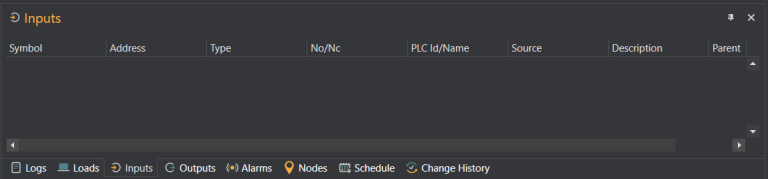
The input/output (IOs) are only relevant when dealing with low level connections. The inputs tab shows which inputs the PLC gets while the outputs tab shows the outputs from the PLC. The tabs look like this when empty:
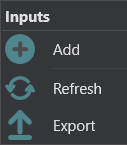
If you right click on the empty input or output window you will see a menu that looks like this:
ADD: Add a new input or output for the PLC. You can also add a new input or output through assemblies REFRESH: Refresh the widow. The window will normally refresh automatically, but you can refresh it here manually if you want to EXPORT: Export inputs or outputs as an Excel file
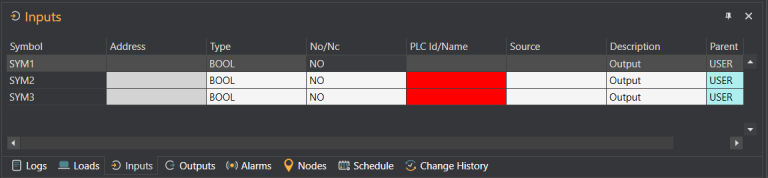
From this menu you can add an input or output. They will then show up as a line in the input or output tab like this:
The lines turn black when you select them (see the first line in the picture above). Any red boxes inform you that the box has not yet been correctly filled out. In the Properties window you can change the symbol and the description of the IO.
4. Alarms
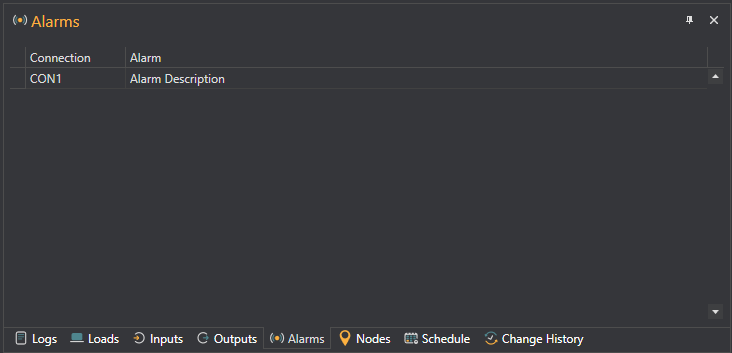
The alarms window is where you can see any alarms which you have set. You can set an alarm by right clicking a connection in the connections window and choosing the ‘alarm’ feature. Click here to read more about setting an alarm with a PLC connection. Once you have added an alarm, the window will look like this:
The ‘Connection’ column shows which PLC connection the alarm belongs to. The ‘Alarm’ column shows the description which you have set for the specific alarm (in this case set as ‘alarm description’).
When the alarm goes off it shows up in the alarms window but it will also show up as a warning in the display below the model:
5. Nodes - Only for Discrete Events Mode
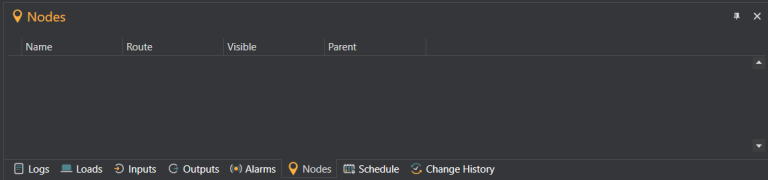
The nodes window shows your action points in discrete events mode. When the window is empty it looks like this:
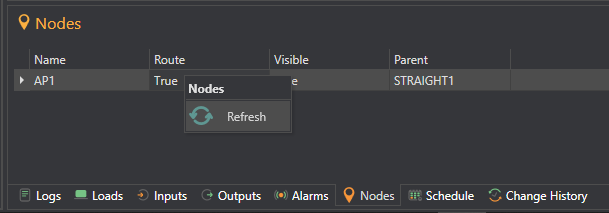
If you want to add an action point first you must make sure you have a conveyor or a track in the scene to add the action point to. Right click the assembly and choose ‘insert action point’. The action point is represented by an x on the assembly. If you then right click in the nodes window and press ‘refresh’ the action points will show up:
Now you can see the properties of the action point in the properties window. From there you can change different attributes of the action point such as its name, color and visibility as well as whether the action point is locked or not.
6. Schedule
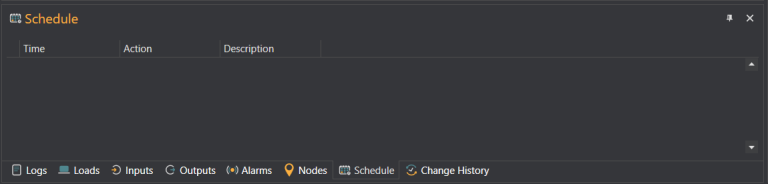
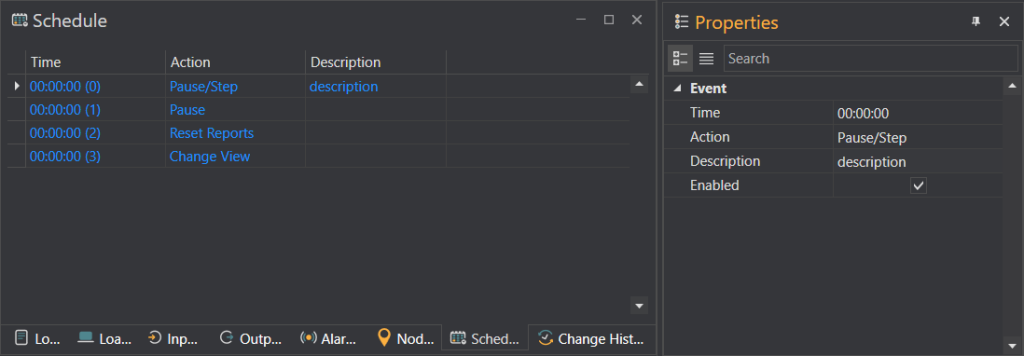
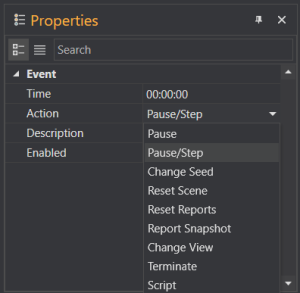
The schedule is where you schedule certain events to happen at specific times. If you right click in the schedule window a menu will pop up giving you the option to add a scheduled event. When you have added an event you will be able to change the settings for the scheduled event in the properties window:
TIME: Set the time for when the event will occur ACTION: Choose which action happens when the set time occurs DESCRIPTION: Enter a description of the scheduled event ENABLED: Set whether the event is active or not
ACTION MENU
PAUSE: Pauses the model RESET SCENE: Resets the model RESET REPORTS: Resets internal counts (e.g. statistics) REPORT SNAPSHOT: Save a report of the model. The report will be saved as an Excel file at the same location as your model is saved. It will be named the name of the model + the time stamp CHANGE VIEW: Change the camera angle (see below) TERMINATE: Terminate Experior SCRIPT: Write your own code to determine what happens when the event occurs (see below)
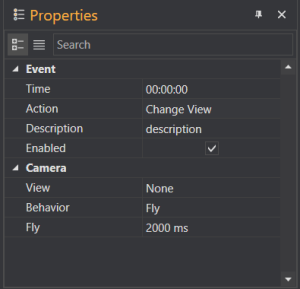
CHANGE VIEW PROPERTIES WINDOW:
With the change view action you can get Experior to change the viewing angle on the model when the event occurs. In the ‘view’ box you can choose any camera view you have preset (click here to see how). You can also set if you want the action to fly to the new camera view or jump to it. If you choose fly, you can set how fast it flies.
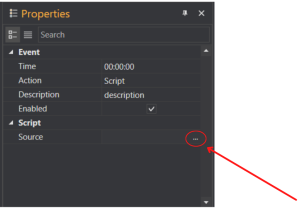
SCRIPT PROPERTIES WINDOW:
The script action is a little different from the others. By pressing the source box three little dots at the end of it will appear. When you click on them it opens a script window where you can write your own code to specify what is supposed to happen when the event occurs.
When an event occurs it will be highlighted in blue in the schedule window. To delete a scheduled event simply right click the event and choose ‘delete’.
7. Change History
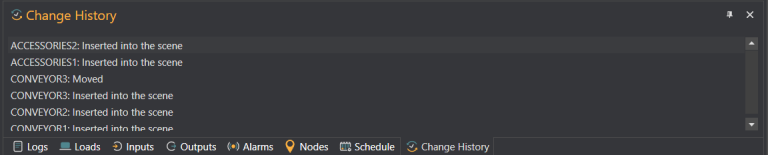
When you place an assembly on to the model or change something in the model, the change will be recorded in the ‘change history’ window like this:
If you right click on any of the actions in the change history window you will be able to undo the action. You can undo your latest actions with the ‘undo’ button in the edit menu but by going in to the change history window you will be allowed to undo specific changes you did further back without loosing everything you have done since.
We use cookies on our website to give you the most relevant experience by remembering your preferences and repeat visits. By clicking “Accept All”, you consent to the use of ALL the cookies. However, you may visit "Cookie Settings" to provide a controlled consent. You can view our policy on privacy and use of cookies in the privacy policy tab found in the bottom of the site
This website uses cookies to improve your experience while you navigate through the website. Out of these, the cookies that are categorized as necessary are stored on your browser as they are essential for the working of basic functionalities of the website. We also use third-party cookies that help us analyze and understand how you use this website. These cookies will be stored in your browser only with your consent. You also have the option to opt-out of these cookies. But opting out of some of these cookies may affect your browsing experience.
Necessary cookies are absolutely essential for the website to function properly. These cookies ensure basic functionalities and security features of the website, anonymously.
Cookie
Duration
Description
cookielawinfo-checkbox-analytics
11 months
This cookie is set by GDPR Cookie Consent plugin. The cookie is used to store the user consent for the cookies in the category "Analytics".
cookielawinfo-checkbox-functional
11 months
The cookie is set by GDPR cookie consent to record the user consent for the cookies in the category "Functional".
cookielawinfo-checkbox-necessary
11 months
This cookie is set by GDPR Cookie Consent plugin. The cookies is used to store the user consent for the cookies in the category "Necessary".
cookielawinfo-checkbox-others
11 months
This cookie is set by GDPR Cookie Consent plugin. The cookie is used to store the user consent for the cookies in the category "Other.
cookielawinfo-checkbox-performance
11 months
This cookie is set by GDPR Cookie Consent plugin. The cookie is used to store the user consent for the cookies in the category "Performance".
viewed_cookie_policy
11 months
The cookie is set by the GDPR Cookie Consent plugin and is used to store whether or not user has consented to the use of cookies. It does not store any personal data.